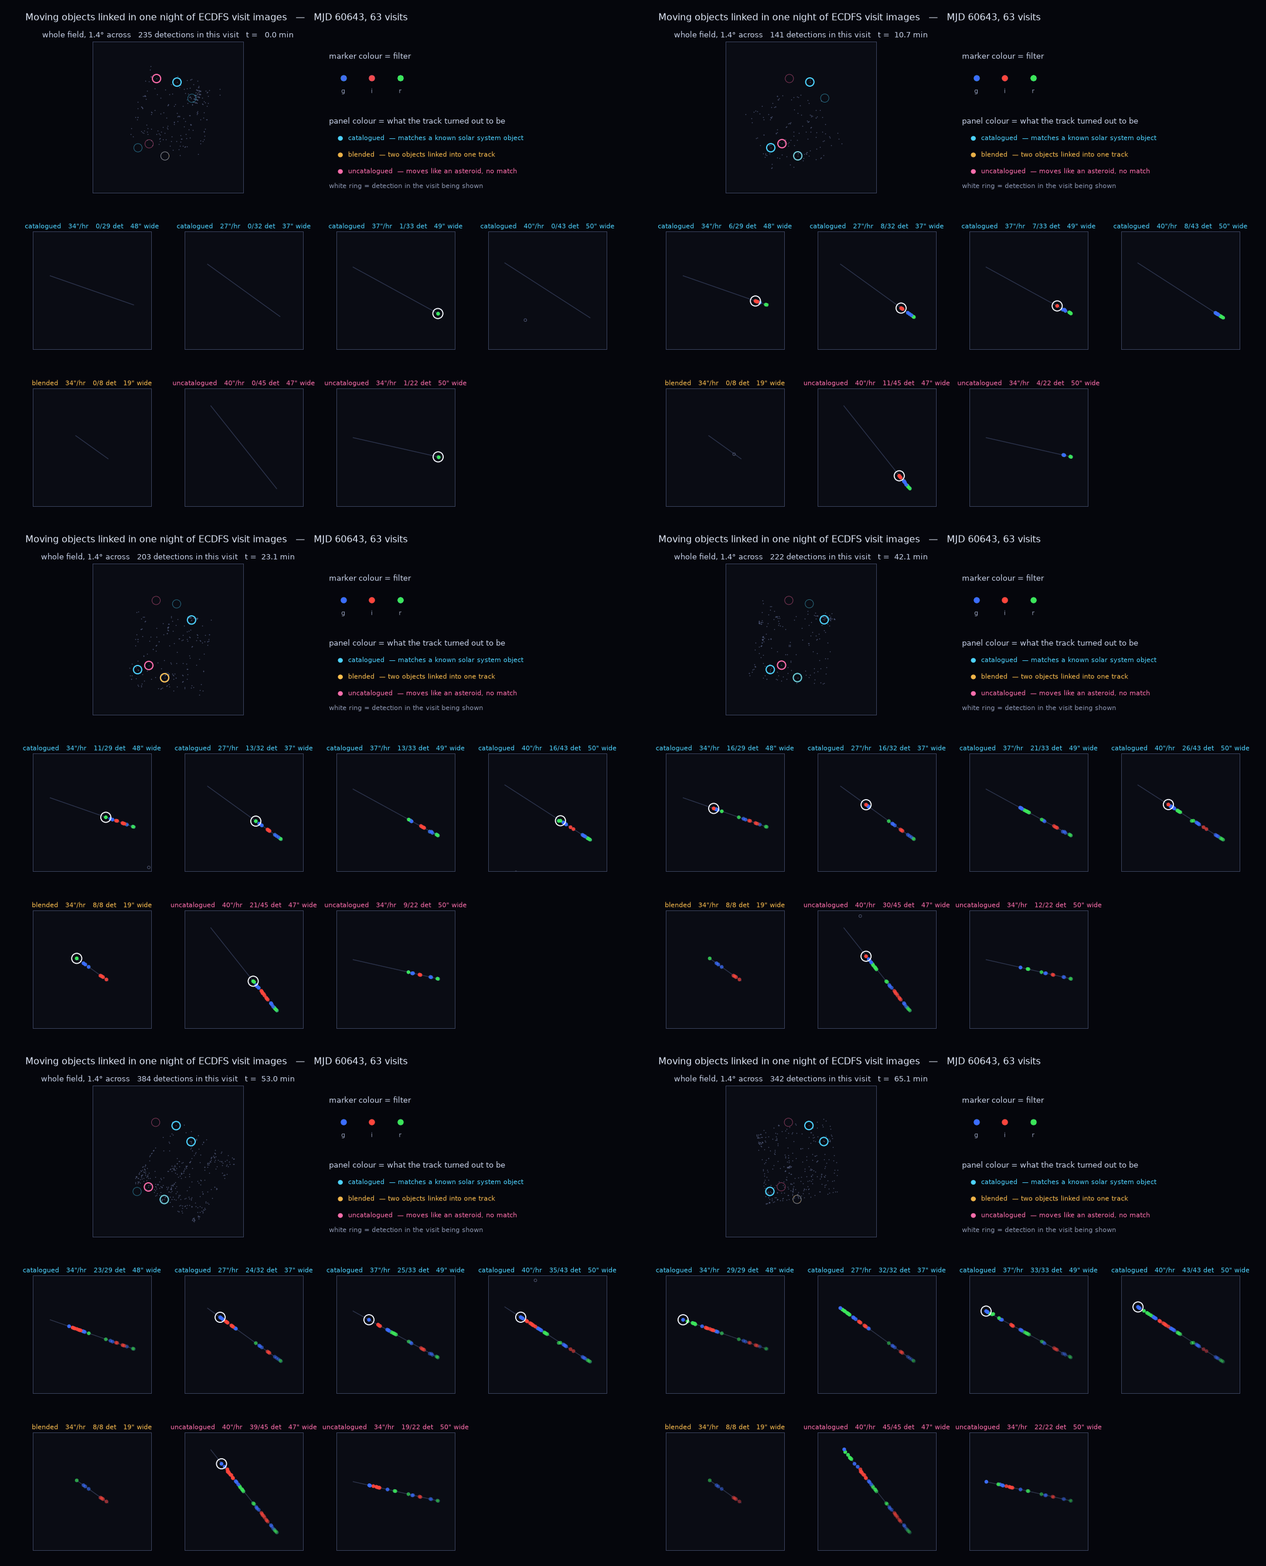
Asteroids are the one population a coadd cannot show you. Outlier clipping is designed to remove anything that is not in the same place every night, so the moving objects are exactly what gets thrown away. They only survive in the individual visits.
These animations come from Rubin Data Preview 1. Everything below uses the
DiaSource difference-image detections and, for the close-ups, the
visit_image pixels fetched through the SODA cutout service.
Joining the single-night tracks across nights is a separate measurement,
recorded here and updated as each stage is run.
The labelled tracklets across Data Preview 2, one catalogued object per night, are mapped here. The brightness is how many of those tracks fall in a cell, not a coadd. Zoom in and one night can be played back from its detections. The hypothesis grids those tracks are tested against are plotted here, one rotatable view per file.
The search never reads the solar system identifications. It removes every detection that recurs at a fixed position, then asks whether any set of the remaining detections falls on a straight line in time: each pair of detections with a plausible angular rate proposes a trajectory, that trajectory is projected to every exposure of the night, and the ones with enough support are kept. The catalogue labels are opened only afterwards, to score the result.
Two features of that animation were not designed in. The catalogued objects accumulate 29 to 43 detections each, so they are enormously over-determined — which is why raising the evidence threshold from four detections to six discarded 113 marginal tracks at the cost of only one real object. And every track moves in nearly the same direction, at position angles of 283°, 289°, 299°, 303°, 306°, 306° and 322°. That common heading is the Earth's own orbital motion projected onto the sky, and nothing instrumental would single out one direction, so it is good evidence these are real solar system objects. It applies to the two uncatalogued tracks as well.
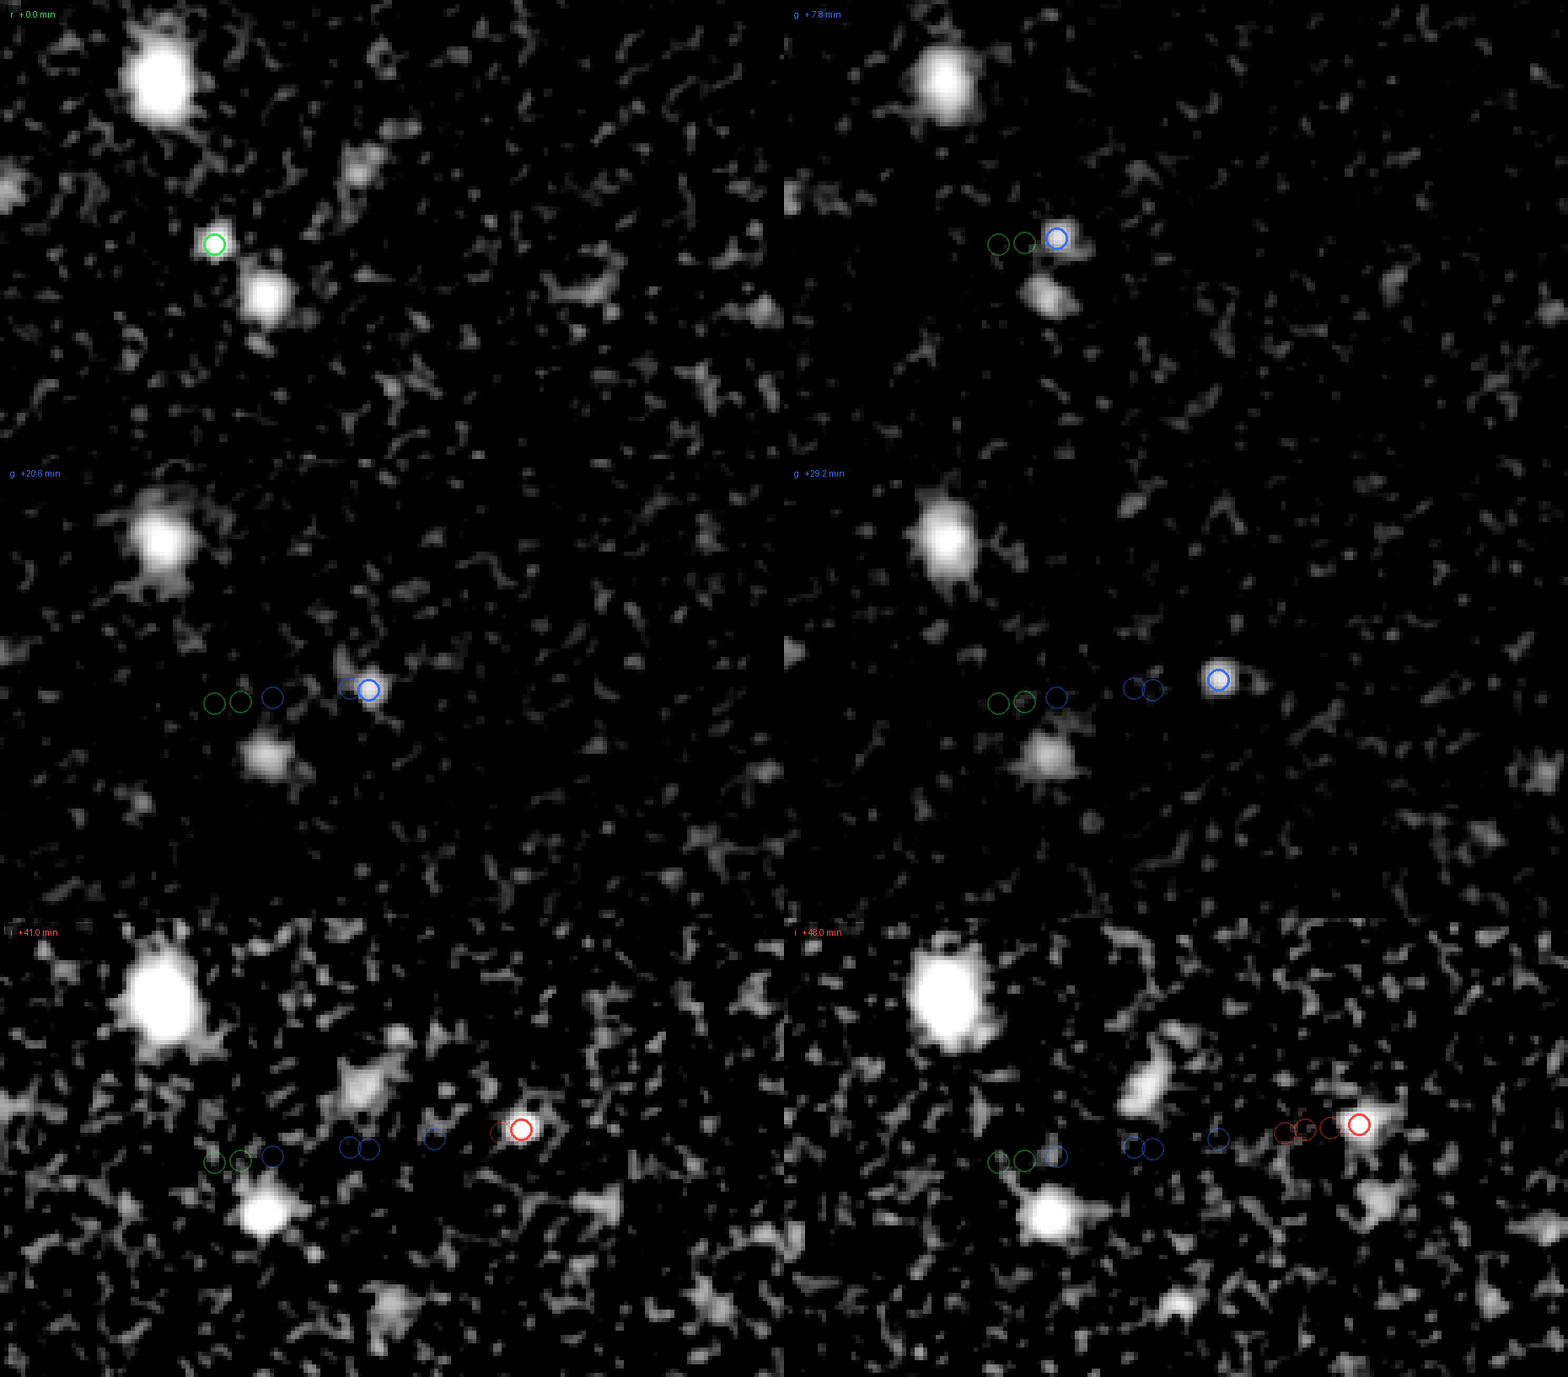
The same objects in the Low Ecliptic Latitude field, at native 0.2 arcsec resolution, each frame resampled onto a common tangent plane so the sky is fixed and only the asteroid moves. The colour changes because Rubin cycles filters between visits, so a single object is caught in r, then g, then i.
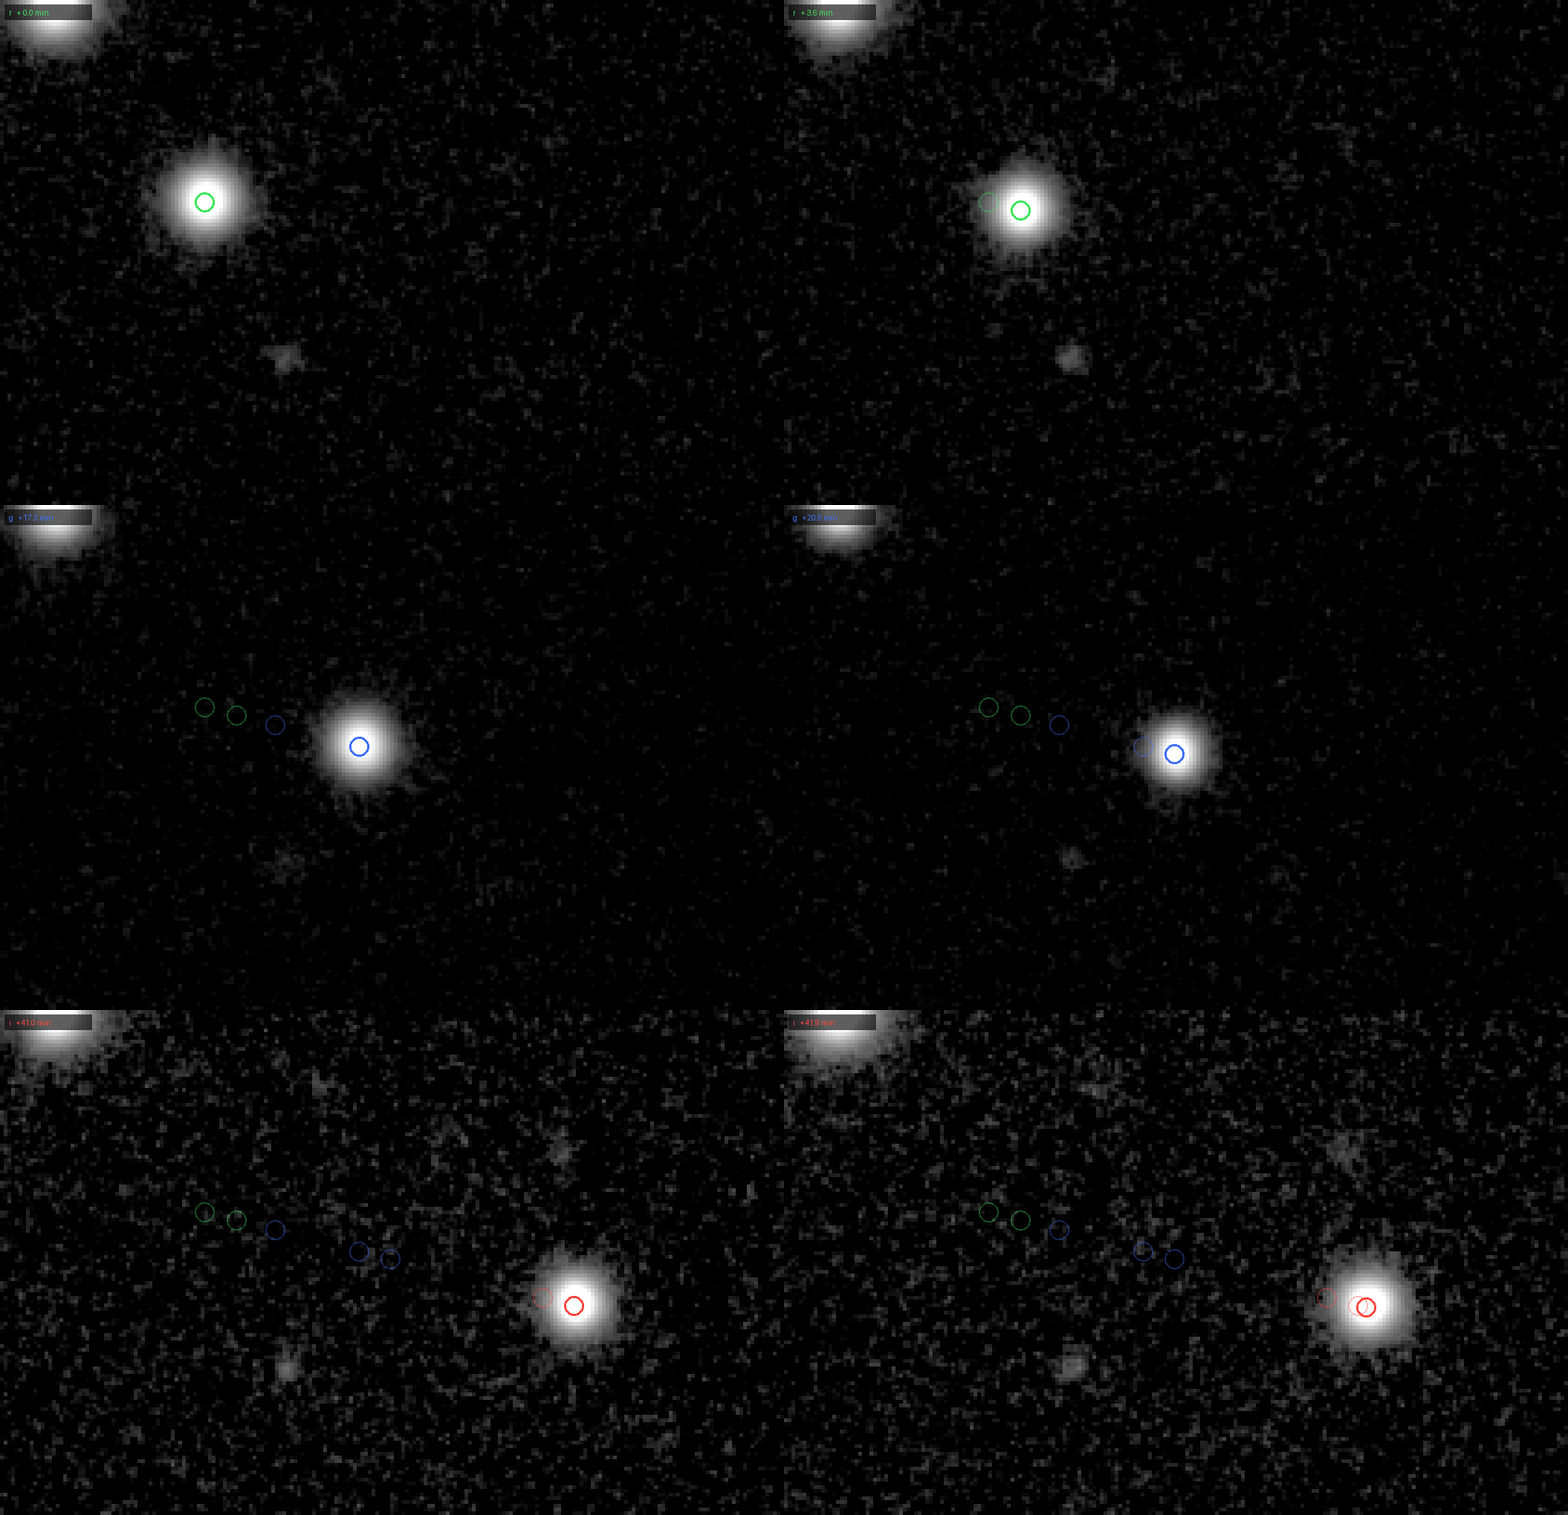
A deep coadd of the Seagull Nebula stacks about a hundred visits taken over nine nights, which is long enough that anything moving is averaged into the background. One catalogued object crossed that field: ten detections over eighteen minutes, 12.8 arcsec of motion, a rate of 42.8 arcsec per hour. Its positions are known to better than a pixel, so it can be marked on the coadd and on the individual differences and the two compared directly.
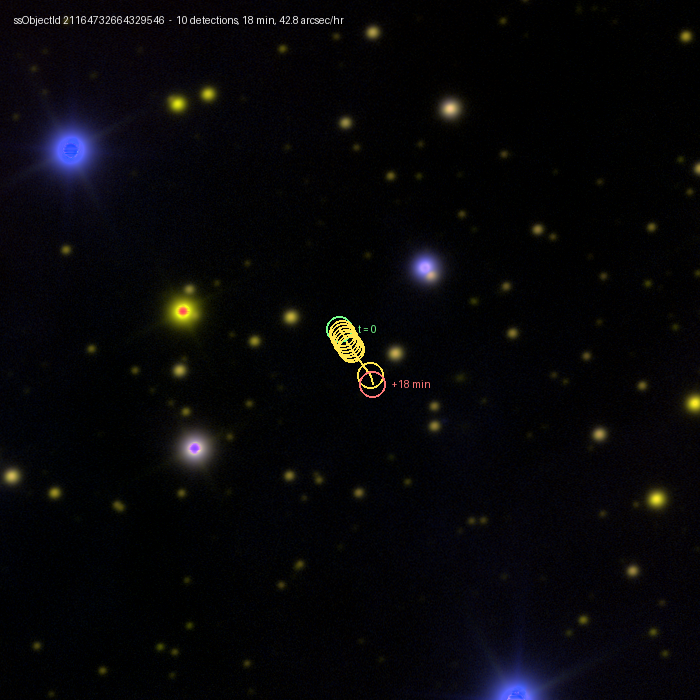
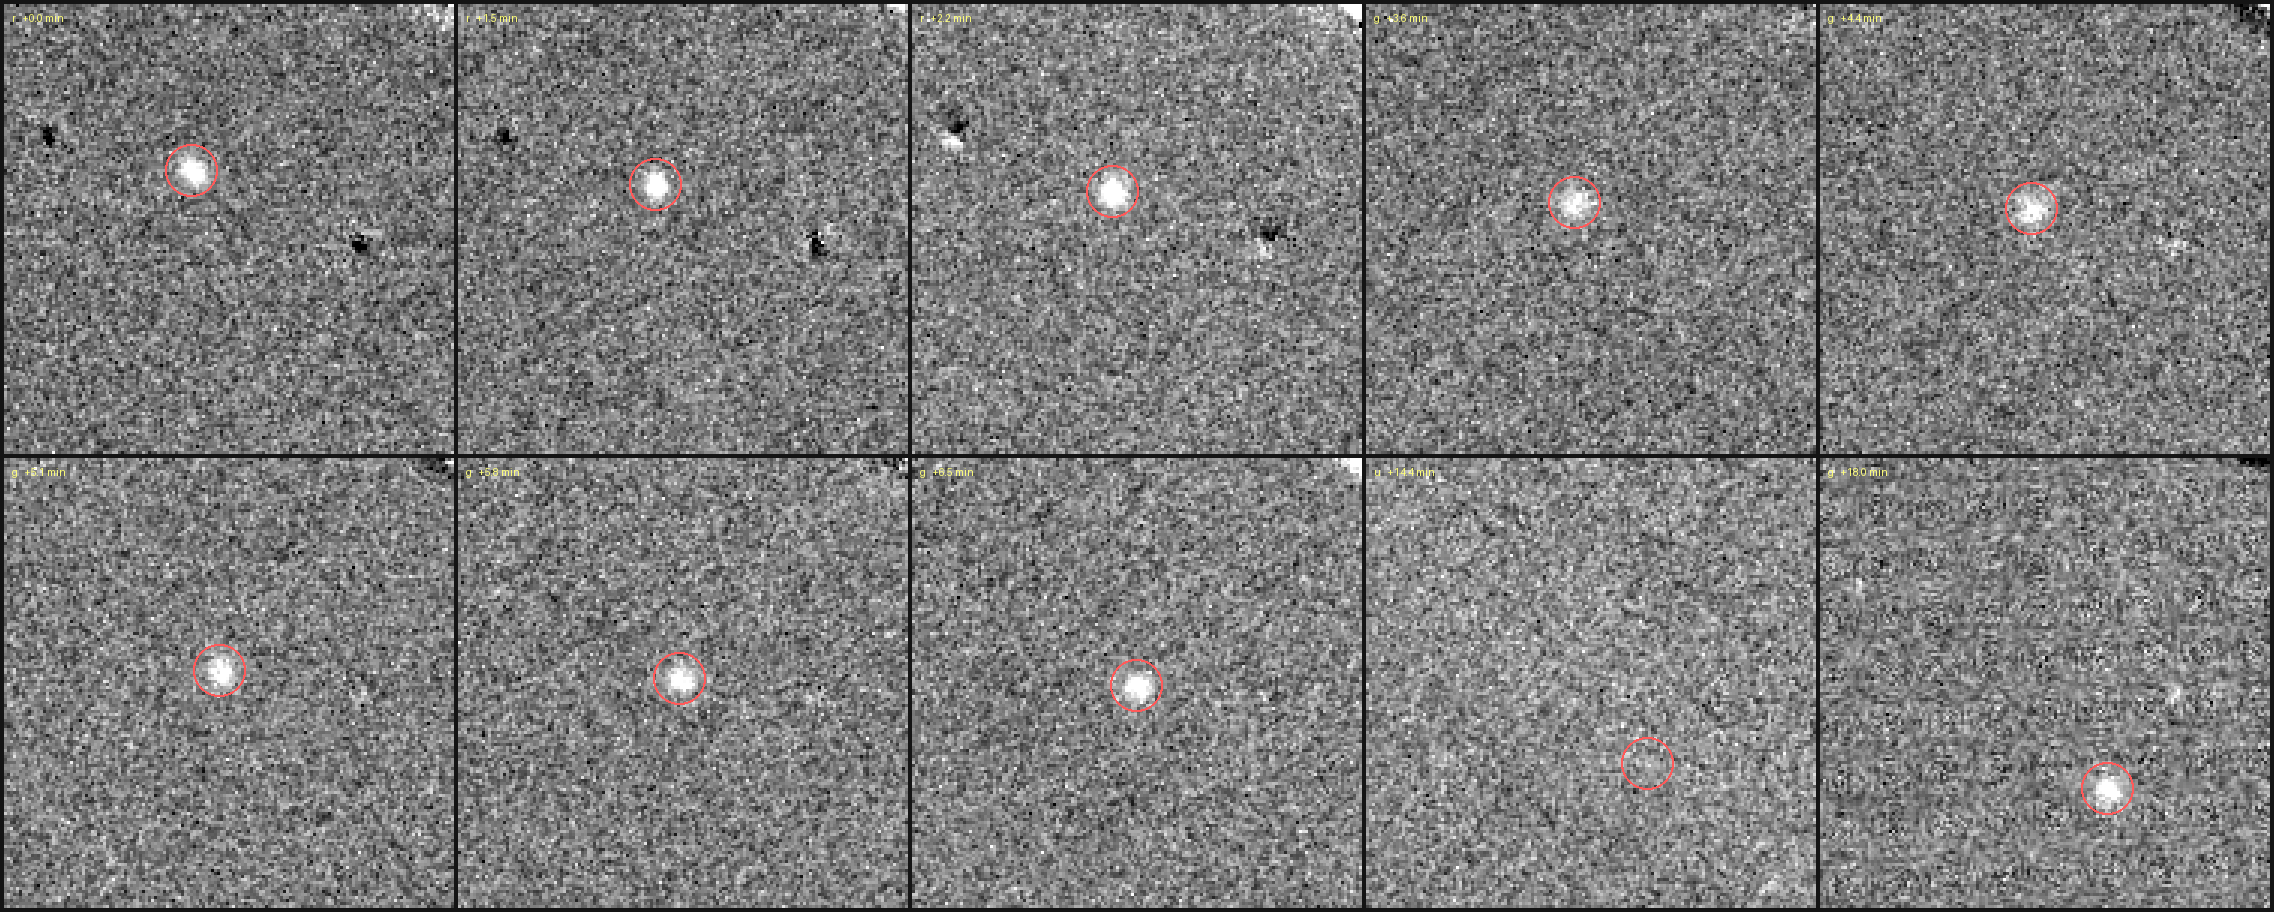
The two views are complementary rather than redundant, and neither alone is enough: the coadd fixes the object against the nebula it crossed but can never contain it, while the differences hold the object and have discarded the nebula.
Scored against the withheld identifications, requiring four detections per track:
| Field | Night | Visits | Objects found | Completeness | Chance tracks |
|---|---|---|---|---|---|
| Low Ecliptic Latitude | 60640 | 34 | 180 / 210 | 85.7% | 0 |
| Low Ecliptic Latitude | 60642 | 31 | 177 / 200 | 88.5% | 0 |
| ECDFS | 60643 | 63 | 5 / 6 | 83.3% | 1 |
| ECDFS | 60645 | 65 | 3 / 3 | 100% | 1 |
| ECDFS | 60651 | 76 | 1 / 1 | 100% | 0 |
The last column is a null test: rotating each exposure about the field centre by its own random angle preserves the source density and the clustering within a visit, but destroys any real motion between visits. It yields essentially nothing, so four detections on a line is already past the reach of chance.
The objects that are missed are not linker failures. They have a median of two to four detections in the whole night, below the evidence threshold, which is a cadence limit rather than an algorithmic one.
Sparse fields are counterintuitive here. ECDFS sits at ecliptic latitude −45° and holds roughly one asteroid for every forty in the low-latitude field, yet completeness is if anything slightly better, because those nights run twice the cadence and each mover collects a median of 32 detections instead of 7. What does not improve is the false-positive floor: the number of marginal four-detection alignments stays around 100 to 150 per night regardless of how many asteroids are actually present, so the useful evidence threshold has to rise with the visit count rather than stay fixed.
The twelve objects found in ECDFS, at ecliptic latitude −45°, are written up here. The diagram shows where they sit in semi-major axis and inclination, and which three Rubin discovered.
The blind search over the whole DP2 window, fourteen nights of real detections, is written up here. The orbits it fitted are drawn in three dimensions.
Two minis of the Aten, Apollo and Amor classes, one with apparent magnitude assigned and one with diameters from 50 m to 3 km, are written up here. The brightness run is drawn in three dimensions.
A mini of 57,002 synthetic main-belt orbits, drawn from the Granvik et al. (2017) selection, is written up here. The orbits are drawn in three dimensions.
A mini of 57,000 synthetic distant orbits, with perihelia from 30 to 42 AU, is written up here.
A mini of 58,800 synthetic hyperbolic orbits on the same 98 fields is written up here. The orbits are drawn in three dimensions.
Data: Rubin Observatory Data Preview 1, accessed through the Rubin Science Platform TAP and SODA services. Filter colours follow the conventional ugrizy ordering and are illustrative, not calibrated.